Built-in modules
ArC2Control comes with an ever expanding collection of experiment modules. They are tailored with crosspoint operations in mind, although they should apply to any kind of two-terminal DUT. More modules will be made available in subsequent releases. All built-in modules typically feature a graph page and a data page which allows you to export the data to an external file.
Retention
Retention is the archetypal “read over time” experiment. It will read one or more crosspoints in fixed intervals at the specified read-out voltage.
Parameter |
Description |
Default value |
|---|---|---|
Read every |
Interval between subsequent reads |
1 second |
Read for |
Total retention duration |
1 minute |
Read at |
Read-out voltage |
Global read-out |
Use global read-out? |
Whether global read-out should be used |
Yes |
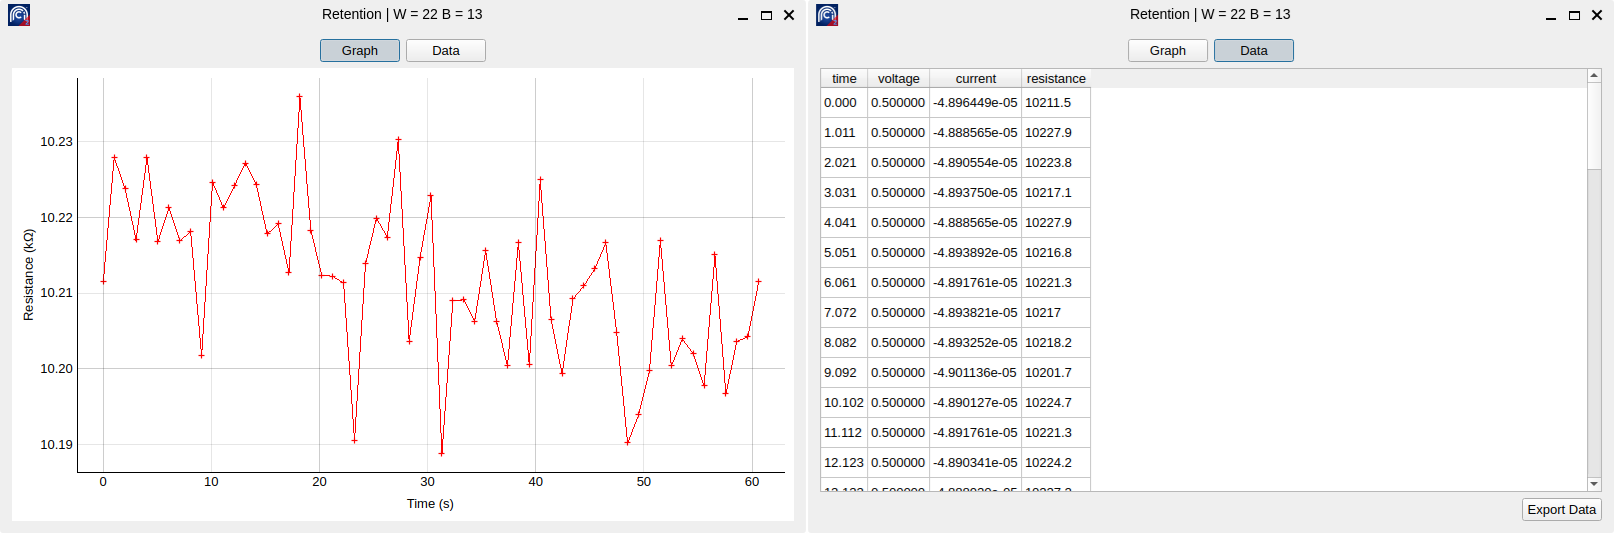
A typical result from a Retention experiment: graph (left) and raw data (right).
Curve Tracer
CurveTracer is another typical experiment that applies a voltage ramp and reads at a specified voltage. It is used to produce an I–V curve of the DUT.
Parameter |
Description |
Default value |
|---|---|---|
Initial voltage |
Voltage starting point |
0.0 V |
Positive Vmax |
The maximum positive polarity voltage |
1.0 V |
Negative Vmax |
The maximum negative polarity voltage |
(-)1.0 V |
Voltage step |
Voltage increment per measurement |
0.1 V |
PW |
Pulse width or step time |
100 ns |
Inter |
Delay between pulses (pulsing mode only) |
100 ns |
Cycles |
Repetition of each measurement loop |
1 |
Pulses |
Number of voltage pulses per step |
1 |
Bias Type |
Modality of pulsing (pulsed or staircase) |
Staircase |
IV direction |
Loop direction |
V₀ → V+ → V– → V₀ |
Read At |
Read-out voltage (at bias or global read-out) |
Bias |
CurveTracer has two different modalities of operation, either Staircase or Pulsed. In the first case bias is never removed from the DUT; it just increases at each step the width of which is governed by the PW attribute. The latter option will apply one or more PW-wide pulses per step followed by an interval specified by the Inter attibute when the voltage is reverted to 0.0 V.

Visualisation of the algorithm used by a pulsed CurveTracer test for 1 cycle, 1 pulse per step, ReadAt bias voltage and loop direction order V₀ → V+ → V– → V₀.
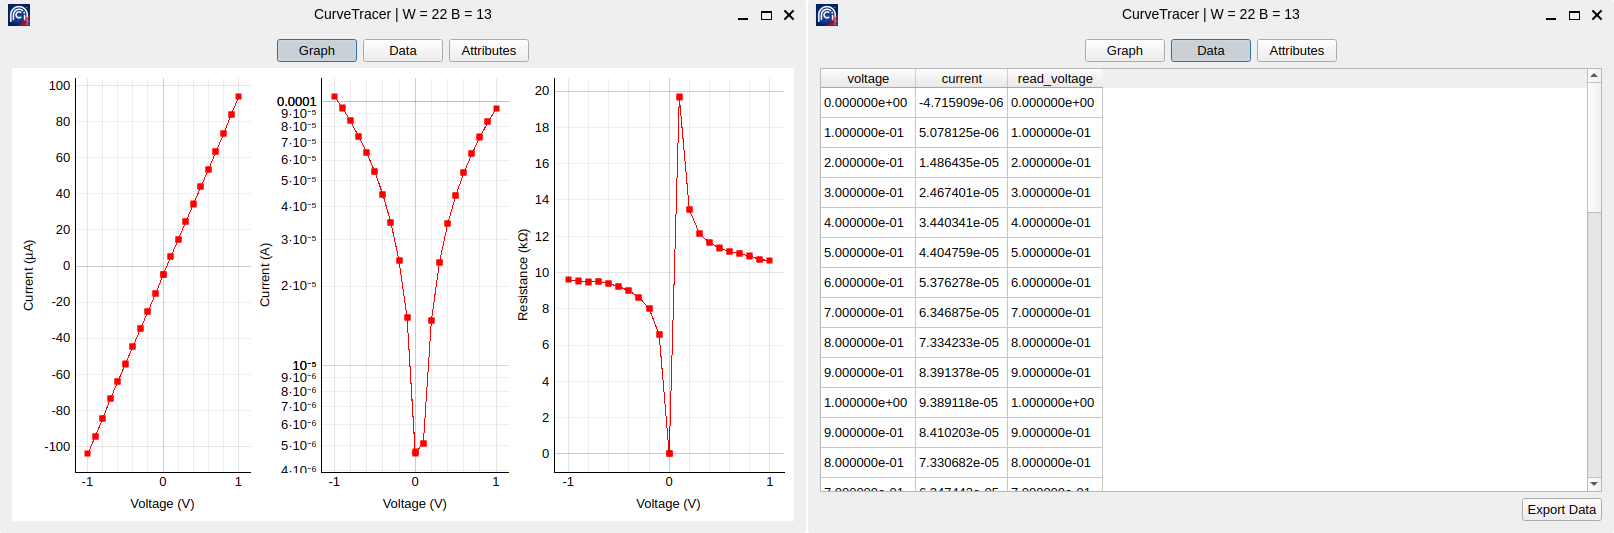
A typical result from a CurveTracer: graph (left) and raw data (right). Graph view shows linear and logarithmic current as well as resistance of the DUT.